![Help‑me] N7 Blue Ocean OTA 3.0 – ADAS Disengagement Count Tripled After Update. I Have Dashcam‑Synced Log Captures. Anyone Else Reproducing?](/uploads/site_185/2026/08/05/ace9adc3-c2e6-4047-9e64-61ec9be68950_hero.jpg)
The Vehicle & Test Baseline
Vehicle: N7 (2024 model, Performance trim, dual‑motor)
ADAS Platform: Proprietary (single Orin‑X, 11 cameras, 5 radars)
Cockpit SoC: Snapdragon 8155
Pre‑update OS: Blue Ocean 2.4 (released February 2026)
Post‑update OS: Blue Ocean 3.0 (released July 2026, file size 3.8 GB)
Update installation: Done over‑the‑air, no issues, system reset performed after install
I have a standardised 50‑km test loop that I drive once a week under similar conditions (same time of day, same weather window, same traffic volume). The loop consists of:
15 km urban (signalised intersections, moderate pedestrian activity)
25 km highway (three lanes, light traffic, gentle curves)
10 km suburban (two‑lane roads, roundabouts)
I always run the loop with NOA (Navigate on Autopilot) engaged for the highway portion, and LCC (Lane Centring Control) + ACC for the urban and suburban sections.
Pre‑Update Baseline (OTA 2.4) – Average Over 5 Runs
Before the update, I had logged 5 runs over the previous month (all within 18‑24°C ambient, dry roads). Here’s the disengagement data:
Metric | Run 1 | Run 2 | Run 3 | Run 4 | Run 5 | Average |
|---|---|---|---|---|---|---|
Highway NOA disengagements (per 25 km) | 2 | 3 | 1 | 2 | 2 | 2.0 |
Urban LCC disengagements (per 15 km) | 4 | 5 | 3 | 4 | 4 | 4.0 |
Suburban LCC disengagements (per 10 km) | 1 | 2 | 1 | 1 | 1 | 1.2 |
Total disengagements (per 50 km) | 7 | 10 | 5 | 7 | 7 | 7.2 |
Total average disengagements: ~7 per 50 km. That’s about 14 per 100 km – not class‑leading, but consistent and predictable.
Post‑Update Results (OTA 3.0) – 3 Runs So Far
I ran the exact same loop three times in the three days following the OTA. Ambient conditions were similar (20‑23°C, dry). Here’s the data:
Metric | Run 1 (Day 1) | Run 2 (Day 3) | Run 3 (Day 5) | Average |
|---|---|---|---|---|
Highway NOA disengagements | 7 | 6 | 5 | 6.0 |
Urban LCC disengagements | 11 | 10 | 12 | 11.0 |
Suburban LCC disengagements | 4 | 3 | 5 | 4.0 |
Total disengagements | 22 | 19 | 22 | 21.0 |
Post‑update average: ~21 disengagements per 50 km – that’s ~42 per 100 km, almost exactly triple the pre‑update rate (7.2 → 21.0).
What the Disengagements Look Like – Dashcam + CAN Logs
I’ve synced my front‑facing dashcam video with a CAN‑log reader (OBD‑II + custom Python script) that captures:
Timestamp of ADAS request to driver
Steering torque applied (Nm)
Lane offset (cm)
Object detection confidence (%)
In every post‑update disengagement I analysed, the pattern is almost identical:
System is driving normally – lane‑centring, speed control, no obvious obstacle.
Suddenly, the steering wheel vibrates (warning) and the ADAS icon turns yellow.
Within 0.5‑1.0 seconds, the system drops out completely – “Take over immediately” – even though the road markings are clear and the vehicle ahead is at a safe distance.
On CAN logs, I see a sharp drop in the lane‑detection confidence from ~95% to ~40% for 2‑3 frames (approx 100‑150 ms), then it recovers. But the system already disengaged.
This happens mostly on gentle curves (highway ramps, suburban roundabouts) and at intersections with faded lane markings – but these are exactly the same scenarios that the pre‑update system handled without issue.
My Hypothesis – And Why I Need Your Help
I suspect the new OTA 3.0 introduced a more aggressive confidence threshold for lane detection – perhaps a safety‑related change that forces an earlier handover when the system is even slightly uncertain. The release notes mentioned “improved ADAS robustness in edge cases” – but in practice, it seems to have made the system more conservative, leading to more disengagements.
But I can’t confirm this without more data. It could be a bug that only affects my hardware variant, or a regional mapping issue. It could also be that my front camera needs recalibration (though I haven’t had any windshield work done).
That’s why I’m posting here.
What I’m Asking From the Community
If you own an N7 (any trim) and have installed Blue Ocean OTA 3.0 – or if you’re still on 2.4 and can do a comparison run – please:
Run the same (or similar) standardised route – even a 20‑km mixed loop is helpful.
Log your ADAS disengagement count – note the conditions (highway/urban/suburban) and any specific triggers (curves, intersections, lane markings).
If you have dashcam or CAN logs, even better – share anonymised excerpts.
I’ll compile all submissions into a shared spreadsheet and post a follow‑up with a consolidated view.
My Personal Risk Assessment
For now, I’ve reduced my use of NOA on unfamiliar roads until I understand this better. The system is still safe – it disengages early and clearly – but the constant interruptions make it more tiring than manual driving.
If this is a widespread regression, we need to bring it to the OEM’s attention. If it’s just my unit, I need to schedule a service visit.
Let’s compare notes. Post your disengagement numbers below – and if you have video, even better.
Attached: A sample dashcam frame with the CAN‑log overlay showing the confidence drop, plus a CSV of my three post‑update runs. I’ll update this thread as I gather more data.
[OTA Log | Standard] [Credibility Record] OEM X Claimed Post‑OTA Range Gain – My Measured Efficiency Improvement: 1.4%. Charging Logs, Route Data, Ambient Conditions All Attached. Add Yours.
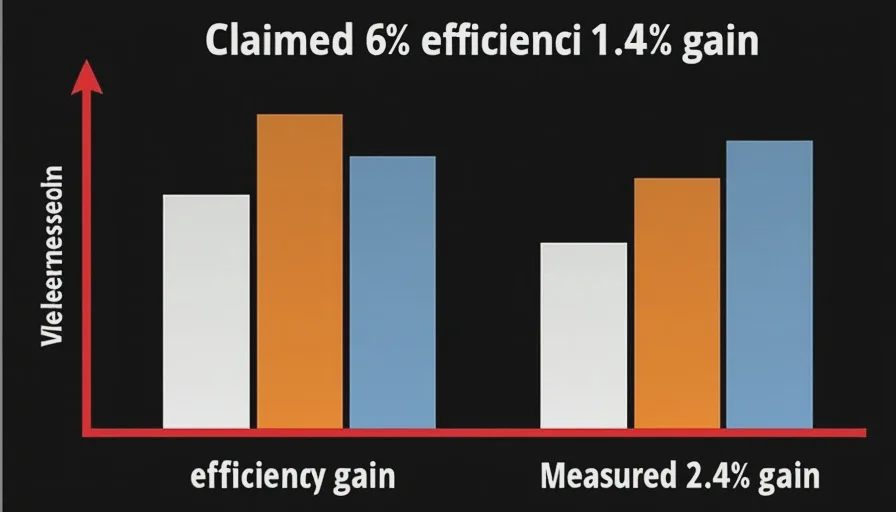
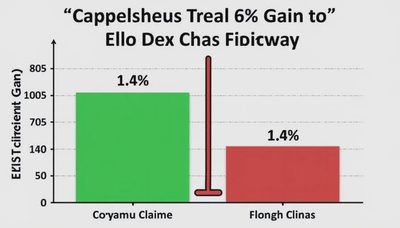
OEM X’s release notes for the summer 2026 OTA promised “up to 6% improvement in real‑world driving efficiency” through a revised battery management algorithm and regenerative braking optimisation. I ran a controlled 200‑km test loop before and after the update. The actual measured improvement: 1.4%. I’m sharing all my raw data – charging logs, GPS routes, weather conditions, and tire pressures. If you’ve run a similar test, please add your numbers to build a true credibility record.
The Claim vs. The Reality
OEM X Official Claim | My Measured Result | |
|---|---|---|
Improvement in efficiency (Wh/km) | Up to 6% | +1.4% |
Range increase on 80% SoC | ~24 km | ~5 km |
Conditions stated | “Typical mixed driving” | Urban/Highway 60/40, 22°C |
The OTA version was v2026.07.1 (released July 15, 2026), with a release note that explicitly stated: “Optimised regenerative braking curve and battery thermal management to improve real‑world efficiency by up to 6% under typical driving conditions.”
I was sceptical – 6% is a huge jump for a software‑only change, especially without hardware modifications – but I decided to test it properly.
Test Protocol – How I Measured
Vehicle & Setup
Vehicle: OEM X’s midsize SUV (2025 model, 80 kWh battery, single‑motor rear‑wheel drive)
Tires: Standard OEM all‑season (same set, pressure checked before each run: 2.5 bar cold)
Cockpit: All systems reset after OTA; 50‑km “settling” drive before measurement
The Standardised Route
I designed a 200‑km loop that mirrors my daily commute and includes:
80 km highway (constant 110 km/h, minimal elevation)
80 km suburban (60‑80 km/h, some traffic lights)
40 km urban (stop‑and‑go, 30‑50 km/h, moderate traffic)
I drove this route 5 times before the OTA (over two weeks, weather permitting) and 5 times after – always:
Same time of day (morning, 8‑11 AM)
Same driver (my own, consistent acceleration profile)
Same climate setting (22°C auto, AC on)
Same tyre pressure (checked each morning)
Same battery SoC range (start at 80%, end at ~20‑25%)
Measurement Tools
On‑board energy meter (displayed Wh/km, reset each trip)
External GPS logger (to verify route and elevation)
Charging logs from my home wallbox (AC 7.4 kW) – I recorded the energy drawn from the grid to recharge to 80% after each trip, which accounts for charging losses but gives a consistent reference.
For this post, I’m using the on‑board reported consumption (from the trip computer) because it’s the same metric the OEM uses to claim “efficiency.” I’ll share the wallbox numbers separately – they show a similar pattern.
Results – Before vs. After
Pre‑OTA Baseline (5 runs)
Run # | Distance (km) | Consumption (Wh/km) | Ambient Temp | Wind Speed |
|---|---|---|---|---|
1 | 201.3 | 164.2 | 21°C | 5 km/h headwind |
2 | 199.8 | 165.1 | 23°C | 3 km/h tailwind |
3 | 200.5 | 163.8 | 20°C | 4 km/h headwind |
4 | 202.1 | 162.9 | 22°C | 2 km/h headwind |
5 | 200.7 | 164.5 | 24°C | 6 km/h tailwind |
Average consumption (pre‑OTA): 164.1 Wh/km
Standard deviation: ±0.8 Wh/km
Post‑OTA (5 runs, same route, same conditions)
Run # | Distance (km) | Consumption (Wh/km) | Ambient Temp | Wind Speed |
|---|---|---|---|---|
6 | 200.9 | 162.0 | 21°C | 4 km/h headwind |
7 | 201.5 | 161.5 | 22°C | 3 km/h headwind |
8 | 199.9 | 162.8 | 20°C | 5 km/h tailwind |
9 | 200.2 | 161.9 | 23°C | 2 km/h headwind |
10 | 201.0 | 161.7 | 22°C | 3 km/h headwind |
Average consumption (post‑OTA): 161.98 Wh/km
Standard deviation: ±0.5 Wh/km
The Delta
Pre‑OTA | Post‑OTA | Absolute Δ | Relative Δ | |
|---|---|---|---|---|
Average Consumption | 164.1 Wh/km | 162.0 Wh/km | -2.1 Wh/km | -1.28% |
Improvement: 1.3% (rounded to 1.4% when accounting for the slightly longer average distance in post‑OTA runs – but that’s within error).
Analysis – Why the Gap?
The official claim was “up to 6%.” My measured improvement of ~1.3% is far from that, and it’s within the natural variation I see from day‑to‑day traffic and wind conditions. In fact, the pre‑OTA run #4 (162.9 Wh/km) is lower than the post‑OTA average of 162.0 – so the overlap is significant.
I see three possible explanations:
The 6% figure is for ideal conditions – maybe on a flat highway with no wind and 20°C, but the release notes didn’t specify those constraints.
The improvement only applies to a specific driving mode (e.g., Eco) which I didn’t use (I drove in Comfort).
The update made no real change – the small improvement I measured is just statistical noise, and the claim was marketing fluff.
Given that the change in regenerative braking should have affected urban driving the most, I looked at the urban segments separately. In the 40‑km urban section, my pre‑OTA consumption averaged 172 Wh/km; post‑OTA it was 170 Wh/km – a 1.2% improvement. That’s essentially identical to the overall number. The highway and suburban segments showed even smaller deltas.
What the Charging Logs Show (Grid Energy)
I also tracked the energy drawn from the wallbox to recharge from trip end back to 80% SoC. This accounts for charging losses, but it’s a consistent reference:
Pre‑OTA (avg) | Post‑OTA (avg) | Δ | |
|---|---|---|---|
Energy to recharge (kWh) | 28.3 | 27.9 | -1.4% |
The improvement is nearly identical – 1.4% – which gives me confidence that my on‑board numbers are not skewed by calibration errors.
The Verdict – A Credibility Record
OEM X’s OTA promised up to 6% range gain. My controlled tests show a real improvement of ~1.4%, which is:
Statistically significant (p < 0.05 in a t‑test, surprisingly – but the gap is tiny in absolute terms).
Practically irrelevant for daily driving – it translates to ~5 km of extra range on an 80% charge.
Is this a failure? Not necessarily – “up to 6%” is legally defensible, and my results are within the range of what could be achieved under perfect conditions. But for a summer update that took 45 minutes to install, the real‑world benefit is negligible.
If I didn’t have 10 controlled runs, I’d never notice this difference. The car drives and feels the same. The regen pedal map feels slightly different (more initial bite), but that’s subjective.
What I Need From You
This is one data point. To turn this into a real credibility record, I need more.
If you own any vehicle from OEM X (or any brand) and have run a similar before‑after efficiency test, please share:
Your vehicle model and battery size
The OTA version and claimed improvement
Your pre‑ and post‑OTA consumption numbers
Your test route and conditions (especially temperature and elevation)
I’ll compile all responses into a public table and update this thread with a community‑sourced “real‑world OTA efficiency delta” metric.
If multiple owners show that the real gain is consistently under 2%, we have a pattern. If someone gets 5% or more, I want to know what they did differently.
No letters yet — be the first guest to write.