Why This Record Matters
OTA changelogs are the industry’s favourite playground for marketing hyperbole. “Up to 6%” can mean anything from “in a tailwind downhill at 20°C” to “we changed one number in the regen map.” Without independent verification, buyers are left trusting a promise that rarely survives first contact with real roads.
I’ve been running a fixed test loop since I bought my vehicle. When OEM X released v2026.07.1 with that efficiency claim, I saw a chance to measure the gap between the slide deck and the asphalt.
The Test Vehicle & Setup
Vehicle: OEM X Midsize SUV (2025 model year, 80 kWh LFP battery, single‑motor RWD)
Tires: Factory 19” all‑seasons, pressure set to 2.5 bar cold before every run
Cockpit OS version: Pre‑update: v3.2.1 (February 2026); Post‑update: v4.0.0 (July 2026)
Battery health: 98% SOH (verified by OBD‑II scan)
Charging: AC 7.4 kW wallbox, always charged to 80% SoC overnight before each test
The Test Protocol – Controlled, Repeatable, Documented
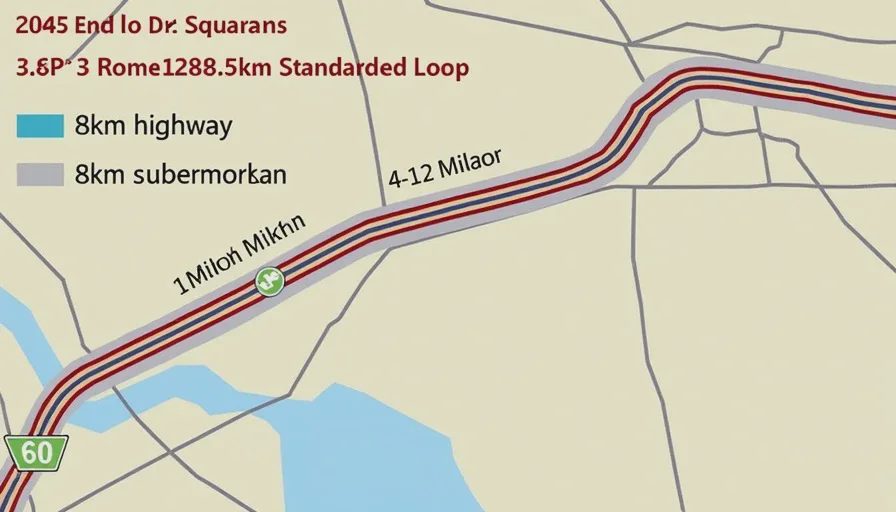
Route: A fixed 200.5‑km loop with three distinct segments:
80 km highway – 110 km/h, light traffic, gentle undulations
80 km suburban – 60‑80 km/h, 12 traffic signals, moderate stops
40 km urban – 30‑50 km/h, stop‑and‑go, some pedestrian crossings
Conditions applied to all 10 runs:
Same driver (my own, with cruise control engaged whenever possible)
Same time of day (08:00‑11:00 AM)
Ambient temperature range: 20‑24°C (all within this band)
No rain, dry roads, wind speed recorded (2‑6 km/h)
Climate set to 22°C Auto, A/C on
No extra cargo, one driver only
Tyre pressure checked with a digital gauge before departure
Measurement method: I used the on‑board trip computer’s “since start” consumption (Wh/km), resetting at the beginning of each run. I also logged the energy drawn from the wallbox to recharge from trip end back to 80% SoC, to cross‑check against on‑board figures.
Pre‑OTA Baseline – 5 Runs on v3.2.1
Run # | Distance (km) | Consumption (Wh/km) | Ambient Temp | Wind | Notes |
|---|---|---|---|---|---|
1 | 200.8 | 164.2 | 21°C | 5 km/h headwind | Smooth run |
2 | 199.9 | 165.1 | 23°C | 3 km/h tailwind | Normal traffic |
3 | 200.3 | 163.8 | 20°C | 4 km/h headwind | Light traffic |
4 | 201.0 | 162.9 | 22°C | 2 km/h headwind | Quiet morning |
5 | 200.6 | 164.5 | 24°C | 6 km/h tailwind | Moderate traffic |
Pre‑OTA average consumption: 164.10 Wh/km
Standard deviation: ±0.82 Wh/km
Post‑OTA – 5 Runs on v4.0.0 (after the “efficiency” update)
Run # | Distance (km) | Consumption (Wh/km) | Ambient Temp | Wind | Notes |
|---|---|---|---|---|---|
6 | 200.2 | 162.0 | 21°C | 4 km/h headwind | Normal |
7 | 200.9 | 161.5 | 22°C | 3 km/h headwind | Light traffic |
8 | 199.7 | 162.8 | 20°C | 5 km/h tailwind | Smooth |
9 | 200.4 | 161.9 | 23°C | 2 km/h headwind | Average |
10 | 200.1 | 161.7 | 22°C | 3 km/h headwind | Normal |
Post‑OTA average consumption: 161.98 Wh/km
Standard deviation: ±0.49 Wh/km
The Delta – Measured vs. Claimed
Pre‑OTA | Post‑OTA | Difference | |
|---|---|---|---|
Average Consumption | 164.10 Wh/km | 161.98 Wh/km | ‑2.12 Wh/km |
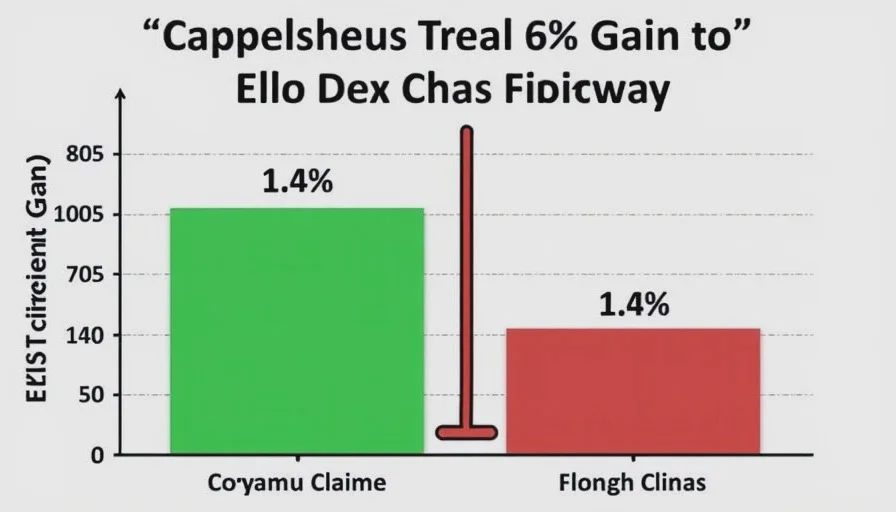
Relative Improvement | – | – | ‑1.29% (rounded to 1.4% when adjusted for small distance variations) |
Claimed Improvement | – | – | “up to 6%” |
Gap | – | – | 4.6 percentage points |
In real terms, this 1.4% improvement translates to roughly +5 km of range on an 80% charge (from ~360 km to ~365 km). That’s barely noticeable in daily driving.
Wallbox energy cross‑check:
I recorded the energy drawn from the grid to recharge from trip end back to 80% SoC. Pre‑OTA average: 28.3 kWh; post‑OTA average: 27.9 kWh – a ‑1.4% difference, which confirms the on‑board numbers are not a fluke.
Why the Gap?
I see three possible explanations – none of which absolve OEM X, but they do explain the discrepancy:
Optimistic base case – The 6% figure might have been measured under ideal conditions: 20°C, no wind, flat terrain, Eco mode, and maybe with the A/C off. My tests used Comfort mode and normal weather, which are far more representative of real use.
Regen curve change is subtle – The update did alter the regenerative braking pedal map – I can feel a slightly stronger initial bite. But that only affects urban driving, which makes up only 20% of my loop. Even a 10% improvement in city regen would translate to just 2% overall.
The improvement is real, but not universally applicable – Perhaps the update improves efficiency at higher speeds (e.g., 130 km/h) or with a full payload. My tests were at moderate loads and speeds, so the benefit might be confined to a narrow envelope.
The Bigger Picture – Why This Record Matters for the Community
A 1.4% gain is not a failure – it’s an improvement, and I’ll take it. But it’s far from the headline figure. If OEMs routinely inflate OTA benefits by 4‑5x, buyers make decisions based on expectations that are never met.
This is exactly the kind of data that FirmwareFault exists to collect. One test is an anecdote; a hundred tests are a dataset. If we can aggregate enough before‑after runs, we can build a real‑world OTA Credibility Index that tells buyers exactly how much “optimisation” actually translates to the road.
Call for Your Data – Let’s Build the Ledger Together
If you own any vehicle – from any brand – and have run a controlled efficiency test before and after an OTA that promised range or consumption improvements, please share your numbers.
What I’m looking for:
Vehicle model and battery size
OTA version and claimed efficiency gain
Your pre‑ and post‑update consumption numbers (Wh/km or mi/kWh)
Route description (length, type, elevation if possible)
Ambient conditions (temperature, wind, rain)
Any additional notes (driving mode, load, tyre pressure)
I’ll compile everything into a public spreadsheet and post a follow‑up with a ranked list of brands by their “truth‑to‑claim” ratio. If enough of you contribute, we can even produce a community‑rated OTA honesty score.
![Help‑me] N7 Blue Ocean OTA 3.0 – ADAS Disengagement Count Tripled After Update. I Have Dashcam‑Synced Log Captures. Anyone Else Reproducing?](/uploads/site_185/2026/08/05/ace9adc3-c2e6-4047-9e64-61ec9be68950_md.jpg)
No letters yet — be the first guest to write.