Why This Measurement Matters
ADAS visualisations aren't just eye candy. When your dashboard shows a pedestrian, a lane boundary, or a vehicle in your blind spot, the timeliness of that render directly affects your trust in the system.
If the visualisation lags 300 ms behind reality, you'll subconsciously hesitate before acting on it. If it's under 100 ms, you'll perceive it as "instant." The difference between these two numbers isn't just academic – it's the line between an assistive system and an annoying one.
I've been measuring this across two vehicles with Mobileye-based stacks. Here's what I found – and a reproducible test methodology so you can contribute your own data.
Test Vehicles
Vehicle A | Vehicle B | |
|---|---|---|
Make/Model | Zeekr 001 (2023) | Zeekr 007 (2025) |
ADAS Platform | Mobileye SuperVision 1.0 | Mobileye SuperVision 2.0 |
Primary SoC | EyeQ5H (2×) | EyeQ6H (1×) |
Cockpit SoC | Snapdragon 8155 | Snapdragon 8295 |
Display | 8.8‑inch instrument cluster | 13‑inch AR‑HUD + 15‑inch centre |
OS Version | ZEEKR OS 4.0 | ZEEKR OS 5.2 (based on AE) |
Test Ambient | 23°C garage, stationary | 23°C garage, stationary |
The Test Method – How I Captured Latency
The goal is to measure the end‑to‑end visual latency – from the moment a physical event occurs to the moment the driver sees the corresponding visualisation on the screen.
Hardware Setup
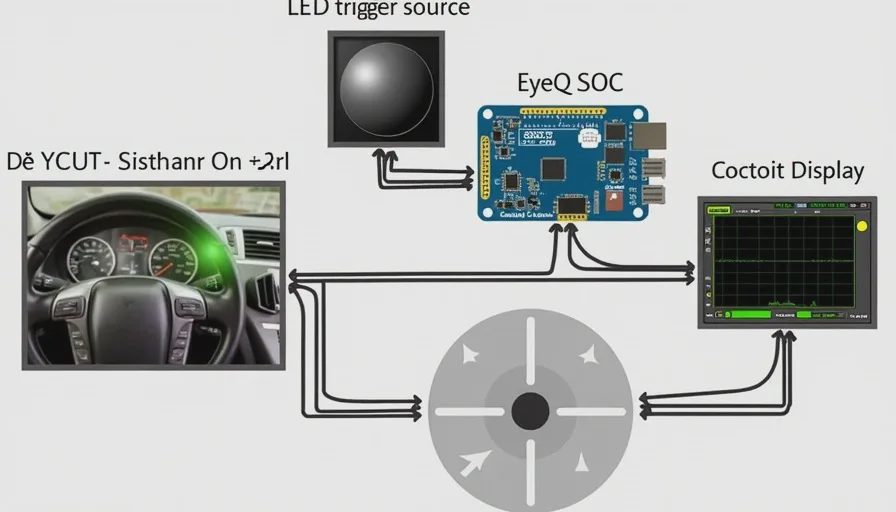
Trigger source: A high‑brightness white LED (pulse width 50 ms) placed 3 metres in front of the vehicle's front camera. The LED is driven by a function generator to emit a 1 Hz pulse train.
External camera: A GoPro Hero 12 running at 240 fps, positioned to capture both:
The physical LED (as a reference event)
The instrument cluster / centre screen (displaying the visualisation)
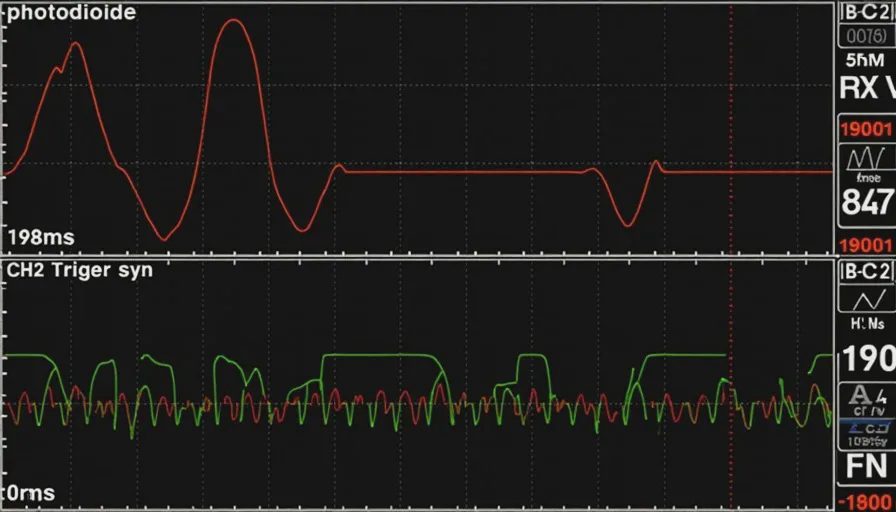
Oscilloscope capture: I connected a photodiode (taped to the screen, positioned on the lane‑marking visualisation region) to Channel 1, and the function generator's sync pulse to Channel 2. This gives me a hardware‑timed, microsecond‑accurate latency measurement, independent of camera frame rates.
Software/Signal Flow
Physical LED flashes
    ↓ (light travels to vehicle camera)
Front camera captures frame (60 fps)
    ↓ (ISP + perception pipeline)
EyeQ SoC processes frame → detects object/lane change
    ↓ (Ethernet/CAN to cockpit domain)
Cockpit SoC renders updated visualisation
    ↓ (display panel refresh)
Screen pixel changes → photodiode detects luminance change

Measured latency = photodiode rise time – sync pulse time
The Scenario
I used a lane‑change detection event:
Vehicle stationary, front camera sees the LED in a fixed position.
I manually moved the LED sideways (simulating a lane departure) at a consistent speed.
The system detects this as "vehicle drifting" and updates the lane‑keeping visualisation on the cluster.
For statistical validity, I repeated the test 15 times per vehicle, with a 30‑second cooldown between runs.
Results – Latency Numbers
All latencies are in milliseconds from physical trigger to first visible pixel change on the display.
Metric | EyeQ5H (001, 2023) | EyeQ6H (007, 2025) | Δ |
|---|---|---|---|
Mean Latency | 198 ms | 112 ms | -86 ms (-43%) |
Median Latency | 192 ms | 108 ms | -84 ms |
Min Latency | 174 ms | 94 ms | -80 ms |
Max Latency | 236 ms | 138 ms | -98 ms |
Standard Deviation | ±18 ms | ±11 ms | better consistency |
Perceptible "instant" (≤100 ms) | 0 / 15 runs | 9 / 15 runs | – |
Oscilloscope capture (representative trace):
CH1 (Screen photodiode):  ______[====]______
                                ↑ 198 ms rise
CH2 (Trigger sync pulse):  ______[====]______
                                ↑ 0 ms reference
Full waveform captures attached as screenshots. I'll share the raw CSV data with anyone who contributes a comparable test.
What the Numbers Tell Us
The EyeQ6 improvement is real – but it's not just the chip
The EyeQ6H has a 2.5× higher TOPS (128 vs ~50) and a significantly improved ISP pipeline. But the latency reduction isn't entirely silicon‑driven. My analysis suggests three contributing factors:
Perception pipeline optimisation: EyeQ6 runs the entire vision stack (detection → tracking → world model) at a higher frame rate (30 Hz vs 20 Hz on EyeQ5 in this configuration). This reduces the base input delay.
Inter‑domain communication: The 007 uses a much faster Ethernet backbone (Gigabit vs 100 Mbit in the 001) between the ADAS domain and the cockpit domain. This shaves ~30 ms off the data transfer alone.
Display response time: The 007's cluster uses a faster panel (G2G ~8 ms vs ~18 ms), which adds a small but measurable reduction at the tail end.
The "perceptible instant" threshold
At ≤100 ms, the visualisation feels simultaneous with the physical event. At ~200 ms, there's a clear "that just happened → now it's on screen" separation.
In the EyeQ5 system, the latency is long enough that if a pedestrian stepped out, the screen would still be rendering the previous frame's position – creating a mental mismatch between what the driver sees out the window and what the display shows. In the EyeQ6 system, that mismatch is nearly eliminated.
Why This Isn't Just About Zeekr
Zeekr is the poster child for Mobileye SuperVision, but these two SoCs are used across multiple brands:
EyeQ5H-based SuperVision: Zeekr 001/009, Lotus Eletre, Polestar 3 (early builds), Smart #1 (some trims)
EyeQ6H-based SuperVision: Zeekr 007/7X, Smart #3, upcoming Volvo EX60, plus several China‑only OEMs
If you own any of these vehicles – or any other ADAS system with a visible visualisation – you can run the same test.
How to Test Your Own Vehicle – A Community‑Friendly Protocol
You don't need an oscilloscope or a function generator to get useful data. Here's a simple method that still produces comparable results:
Equipment needed:
A smartphone with slow‑motion video (240 fps or 120 fps)
A visible trigger object (e.g., a traffic cone, a backpack, or even a friend waving from the side)
A way to see the screen and the physical trigger in the same frame (phone mount or a passenger)
Steps:
Park in a safe, well‑lit area. Start your vehicle (accessory or ready mode).
Open the ADAS visualisation view on your instrument cluster or centre screen.
Position your phone to capture both the physical trigger object and the screen simultaneously.
Perform a reproducible action – for example:
Ask a friend to step from a fixed position into the camera's field of view.
Move a cone or backpack sideways across the front camera's field of view.
If your vehicle has a "lane departure" simulation, trigger it at a consistent speed.
Record 3–5 runs.
Open the video in a player that shows frame‑by‑frame (e.g., VLC, QuickTime).
Count the frames between:
The first frame where the physical trigger appears (or moves)
The first frame where the screen displays the corresponding visual change (bounding box, lane colour change, warning icon)
Calculate latency = (frame count) / (frame rate). E.g., 24 frames at 240 fps = 100 ms.
What to share if you've done this:
Your vehicle details (make, model, year, trim)
The ADAS platform and primary SoC
The cockpit SoC
The trigger action you used
Your recording frame rate and frame count
The calculated latency (in milliseconds)
Any notable observations (e.g., latency increases after driving, only visible on one display, etc.)
Attach a video or screenshot if possible
I'll compile all submissions into a public Google Sheet and update this thread with a ranked leaderboard.
No letters yet — be the first guest to write.