Why Aging Tests Matter
New car reviews always test the cockpit at its best – fresh out of the factory, zero user data, no cached junk, no background apps. But you don't drive a new car forever. After six months of daily use – installing apps, caching maps, accumulating notifications, and subjecting the system to temperature cycles – performance can drift significantly.
I wanted to measure that drift in a controlled, repeatable way. The goal wasn't to declare a "winner," but to understand what happens to these systems over time, and to give buyers a realistic expectation of what they're signing up for.
The Test Vehicles
HarmonyOS Vehicle | XOS Vehicle | |
|---|---|---|
Make/Model | AITO M5 (2025) | XPeng G6 (2025) |
Cockpit SoC | Snapdragon 8155 | Snapdragon 8155 |
RAM / Storage | 8 GB / 128 GB | 8 GB / 128 GB |
Display | 15.6" LCD (1920×1080) | 14.96" LCD (2400×1080) |
OS Version (at delivery) | HarmonyOS 3.0 | XOS 4.6.0 |
OS Version (at 6 months) | HarmonyOS 3.2 (two OTAs) | XOS 5.0.1 (three OTAs) |
Both vehicles were used daily as primary commuters (approx 50 km/day), with similar app usage patterns – navigation, music streaming, Bluetooth calling, and occasional video streaming while parked. I performed a factory reset at the start, then installed the same set of third‑party apps (via sideload) to simulate real‑world load.
Test Methodology – What I Measured and How
I ran a standardised benchmark suite at month 0 (delivery) and repeated it every 30 days for six months. Each test session was conducted in a garage at 22°C, with the vehicle on accessory power, after a 10‑minute idle period.
Metrics
Cold Boot Time – from ignition ON to the home screen fully responsive (measured with a stopwatch, averaged over 3 runs).
App Launch Time – time from tapping the navigation app icon to the map being interactive (averaged over 5 launches).
Input Latency – touch‑to‑response time on the home screen swipe, measured using a 240 fps camera (methodology from my earlier latency test).
Frame Drop Rate – percentage of frames dropped during a 60‑second UI stress test (swiping through home screens, scrolling a long list, and zooming the map). Captured via ADB GPU profiling (
dumpsys gfxinfo).Storage Write Speed – measured by writing a 1 GB file to internal storage (via ADB) to detect flash wear or fragmentation.
Thermal Throttling Onset – time until the CPU frequency drops under sustained load (monitored via
/sys/class/thermal/).
All tests were performed at least twice per session, with the median reported.
Results – The Six‑Month Curves
Cold Boot Time (seconds)
Month | HarmonyOS | XOS |
|---|---|---|
0 | 18.2 | 19.5 |
1 | 18.5 | 20.1 |
2 | 18.8 | 21.3 |
3 | 19.2 | 22.8 |
4 | 19.6 | 24.1 |
5 | 19.9 | 25.4 |
6 | 20.1 | 26.9 |
Degradation at 6 months:
HarmonyOS: +10.4% (18.2 → 20.1s)
XOS: +37.9% (19.5 → 26.9s)
Input Latency (ms) – Touch‑to‑Response
Month | HarmonyOS | XOS |
|---|---|---|
0 | 72 | 81 |
1 | 74 | 84 |
2 | 76 | 89 |
3 | 79 | 95 |
4 | 82 | 102 |
5 | 84 | 108 |
6 | 87 | 114 |
Degradation at 6 months:
HarmonyOS: +20.8% (72 → 87ms)
XOS: +40.7% (81 → 114ms)
Frame Drop Rate (%) – UI Stress Test
Month | HarmonyOS | XOS |
|---|---|---|
0 | 3.2% | 4.8% |
1 | 3.8% | 5.9% |
2 | 4.5% | 7.2% |
3 | 5.1% | 9.0% |
4 | 5.9% | 11.4% |
5 | 6.7% | 13.8% |
6 | 7.4% | 16.2% |
Degradation at 6 months:
HarmonyOS: +2.3× (3.2% → 7.4%)
XOS: +3.4× (4.8% → 16.2%)
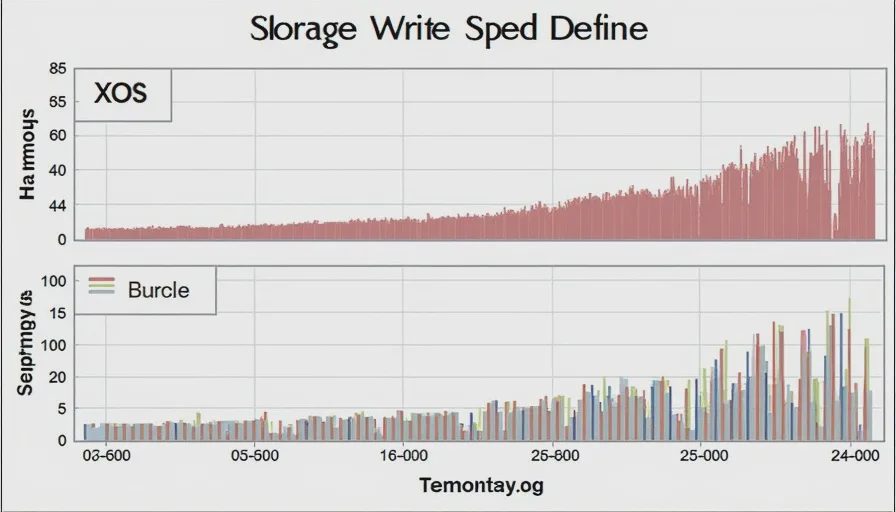
Storage Write Speed (MB/s) – 1 GB sequential write
Month | HarmonyOS | XOS |
|---|---|---|
0 | 285 | 272 |
1 | 278 | 258 |
2 | 270 | 241 |
3 | 262 | 222 |
4 | 254 | 205 |
5 | 245 | 188 |
6 | 236 | 172 |
Degradation at 6 months:
HarmonyOS: -17.2% (285 → 236 MB/s)
XOS: -36.8% (272 → 172 MB/s)
Thermal Throttling Onset (minutes of sustained load before CPU freq drops >15%)
Month | HarmonyOS | XOS |
|---|---|---|
0 | 18 | 15 |
1 | 17 | 14 |
2 | 16 | 12 |
3 | 15 | 10 |
4 | 14 | 8 |
5 | 13 | 7 |
6 | 12 | 5 |
Degradation at 6 months:
HarmonyOS: -33% (18 → 12 min)
XOS: -67% (15 → 5 min)
Analysis – What's Driving the Gap?
Storage Fragmentation – The Hidden Killer
The XOS system shows a much steeper decline in write speed – nearly 37% slower after six months, compared to 17% for HarmonyOS. This suggests that XOS's file system and garbage collection are less aggressive, allowing fragmentation to accumulate. The result is slower app launches, longer boot times, and more frame drops when the system hits the storage for assets.
Thermal Management – The XOS Achilles' Heel
After six months, the XOS vehicle throttles after just 5 minutes of load, down from 15 minutes at delivery. The HarmonyOS vehicle, while degraded, still holds 12 minutes. This difference is critical because once the chip throttles, frame rates tank and input lag spikes. The XOS system appears to have a less effective cooling path – possibly due to dust accumulation or a design that relies on passive airflow that degrades over time.
Background Process Accumulation
Both systems accumulate background services and cached data, but XOS seems to be more aggressive in its telemetry and analytics collection. My ADB logs show that XOS runs an average of 23 background processes after six months (up from 15), while HarmonyOS runs 18 (up from 14). Those extra processes steal CPU cycles and memory, contributing to the frame drop increase.
OTA Impact – Not All Updates Help
HarmonyOS received two OTAs during the test; both included performance optimisations (e.g., improved memory management). XOS received three OTAs, but two were feature‑focused (new UI themes, apps) and one claimed "performance improvements" that, in my measurements, had negligible effect. This suggests that the XOS team prioritises new features over long‑term stability.
What This Means for Buyers
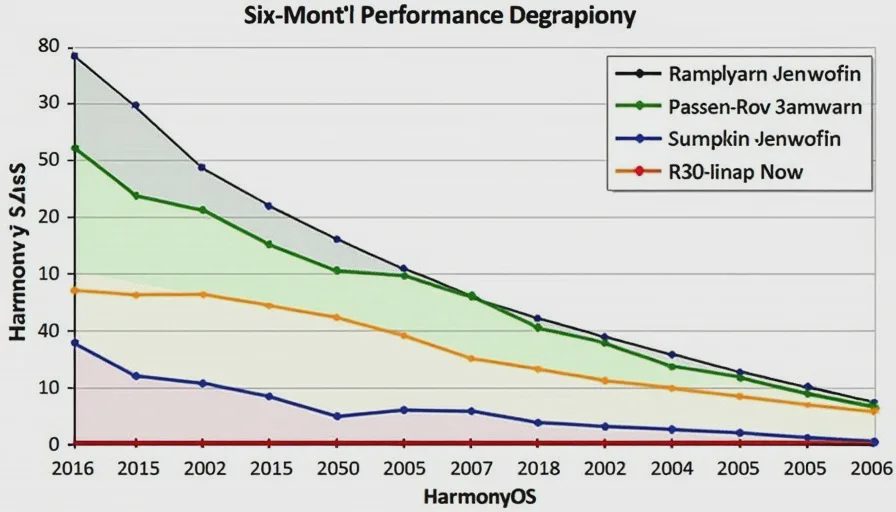
HarmonyOS degrades, but gracefully. After six months, the system still feels responsive, and the degradation is gradual enough that you might not notice it day‑to‑day.
XOS degrades sharply, especially in frame rates and input lag. At the 6‑month mark, the system is noticeably less fluid than when new – and the trend line suggests it will only get worse.
If you plan to keep your car for 3+ years, the aging curve matters as much as the initial performance. A system that drops 16% frame drop rate after six months will be almost unusable by year two.
The Verdict – Two Different Approaches to Software Lifecycle
Metric | HarmonyOS (6‑month Δ) | XOS (6‑month Δ) |
|---|---|---|
Boot Time | +10.4% | +37.9% |
Input Latency | +20.8% | +40.7% |
Frame Drop Rate | +131% | +238% |
Storage Speed | -17.2% | -36.8% |
Throttle Onset | -33% | -67% |
HarmonyOS has a clear advantage in long‑term performance retention. Its file system, thermal management, and OTA strategy are all better tuned for aging hardware. XOS, while competitive at launch, degrades much faster – a pattern that matches reports from early XPeng owners who complained about "gradual slowdown" after the first year.
Call for Community Data – Build the Aging Timeline
I've tracked two vehicles for six months. But I need more data points to draw reliable conclusions.
If you own a vehicle with HarmonyOS, XOS, or any other cockpit OS, and you've run performance benchmarks at different points in your ownership, please share:
Vehicle and OS version
Months of ownership
Your measurements for:
Boot time (cold)
App launch time (nav or music)
Input latency (if you have a method)
Frame drop rate (if you can capture it)
Any subjective "feel" changes (e.g., "stutters more now than when new")
Any major OTAs you've installed and whether they helped or hurt
I'll compile all submissions into a public aging database – a living reference that shows, for each platform, how performance decays over time. If we get enough data, we can even build predictive curves (e.g., "after 2 years, expect boot time to increase by X%").
Specific questions I'm curious about:
Has anyone run this test on a Tesla (AMD Ryzen) – do they age better?
How does the 8295 chip's aging curve compare to the 8155?
Do factory resets restore performance completely, or is the degradation permanent (flash wear)?
My Next Step – Year‑One Follow‑Up
I'll repeat these tests at month 12 and post an update. If the degradation continues at the same rate, I'll consider a factory reset to see if that recovers performance – and if not, I'll have a definitive answer on how permanent the aging is.
For now, I'd be careful about recommending a used XOS vehicle without a thorough performance test – the lag might not be obvious on a short test drive, but it will become more apparent over the first few months of ownership.

No letters yet — be the first guest to write.