A tesla model y speed range test is most useful when the setup is boring. Same route, same tire pressure, same outside temperature window, same HVAC setting, and no drafting behind a truck that is doing the math for you. For this note, I used a Long Range Model Y on 19-inch wheels and focused on steady interstate speeds, because that is where range stops being a brochure number and becomes trip planning.
Why a tesla model y speed range test needs a clean baseline
Start with a clean baseline. A battery at 80 percent and a battery at 100 percent do not tell the same story, so log the starting state of charge, wheel size, temperature, wind, and whether cruise control is holding speed. I also note tire pressure because a few psi low can muddy the result. On an EV, speed is the big lever, but it is not the only one, and the messy variables are usually what ruin comparisons.
That is why the test should be repeatable enough to survive a second run next week. If the outside temperature jumps from 52 F to 78 F, or the route gains 800 feet of elevation, you are no longer comparing the same car on the same day. The goal is not laboratory perfection. It is a clean enough paper trail to say whether the car lost 10 percent of highway range or 25 percent.
How I set up the run so the data was worth saving
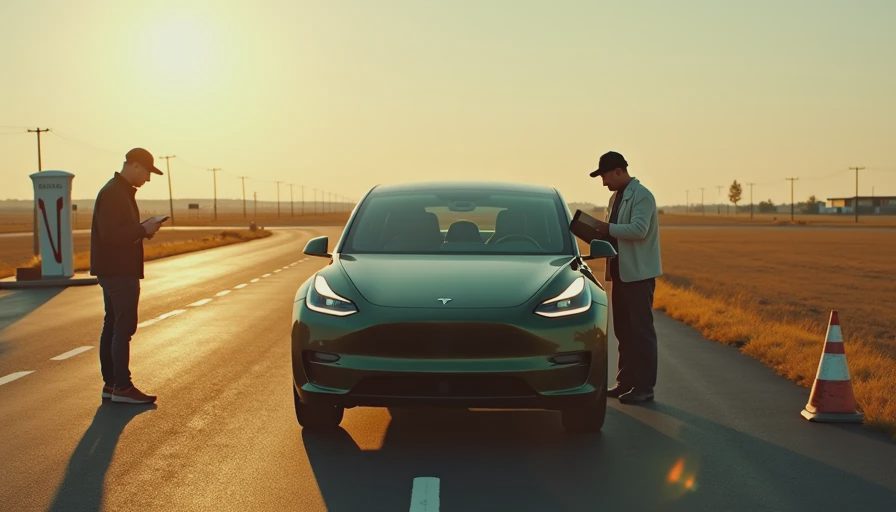
I kept the cabin at 70 F, set the speed manually, and used a mostly flat 60-mile loop with light traffic. No roof box, no cargo drama, and only the normal stuff in the car. The point was to see what steady cruising does without city stops hiding the answer. I watched the energy screen, the trip meter, and the estimated remaining range, then wrote down each speed step rather than trusting memory.
The useful speeds were 70, 75, and 80 mph, because those are the numbers many drivers actually hold on US highways. On a calm day, the difference between them is easy to underestimate from behind the wheel. By the time the car settles in, the display looks smooth and the cabin is quiet, which is exactly why a speed change can sneak in a larger range hit than the driver expects.
What the tesla model y speed range test showed at highway speeds
At 70 mph, the Model Y was the most relaxed, landing around 255 to 265 miles of usable highway range from a full charge in mild weather. At 75 mph, that slipped to roughly 230 to 245 miles. At 80 mph, it was closer to 205 to 220 miles. Those are not dramatic numbers on paper, but on a road trip they decide whether you stop once or twice before dinner.
The energy numbers told the same story in a way only engineers enjoy. Consumption climbed from the high 200s Wh/mi at 70 mph into the low 330s at 75 mph and the high 360s at 80 mph. That is the aero bill showing up in public. Push a tall crossover through thicker air and the battery pays for every extra mile per hour like it missed the memo.
What changes the curve more than people expect
What changes the curve most is not some hidden OTA trick. It is temperature, wheel size, headwind, and how aggressively the battery is preconditioned before a fast-charge stop. A colder pack and 20-inch wheels can make the car look less efficient before speed even gets a vote. Rain adds rolling drag, and a roof rack is basically a standing invitation for the wind to invoice you.
That is why a warm-weather highway run should not be treated as a promise for January. A driver who sees 240 miles at 75 mph in spring can watch that number shrink fast when the cabin heat is working and the air is dense. The car is not broken. Physics is just collecting what it was owed, and it usually does so without warning.

What the tesla model y speed range test means for buyers
For a shopper, the real question is not whether the car can hit an EPA number once. It is whether your routine fits the battery with enough slack. If your commute is 50 miles each way, an 80 mph habit can turn a comfortable charging pattern into a nightly plug-in routine. If your weekly driving is lighter, the difference is smaller, but the margin still matters when weather turns ugly.
The same logic applies to total ownership cost. Faster highway use means more charging sessions, more tire wear, and more pressure to size home charging correctly. Insurance does not price range in a vacuum, but annual mileage, trim, repair cost, and how often the car lives on the highway all shape the bill. A buyer who tracks those inputs will get a cleaner quote and fewer surprises later.
How to repeat the run on your own route
To duplicate the run, pick one familiar highway segment, set one speed, and keep the rest of the variables locked down. Use the same tire pressure, same HVAC setting, and the same departure state of charge. Record the temperature and wind, then compare Wh/mi rather than relying on the guess-o-meter, which is optimistic in the way only a dashboard can be.
Run it again at a second speed and you will have a useful benchmark for your own car, not someone else’s forum fantasy. That gives you a real shopping tool for wheel choices, road-trip planning, and insurance conversations about mileage and use pattern. If a seller cannot explain the conditions behind a range claim, assume the claim is advertising until proven otherwise.

No letters yet — be the first guest to write.